Restaurant Profit Margin Guide & Cost Control | Billzova
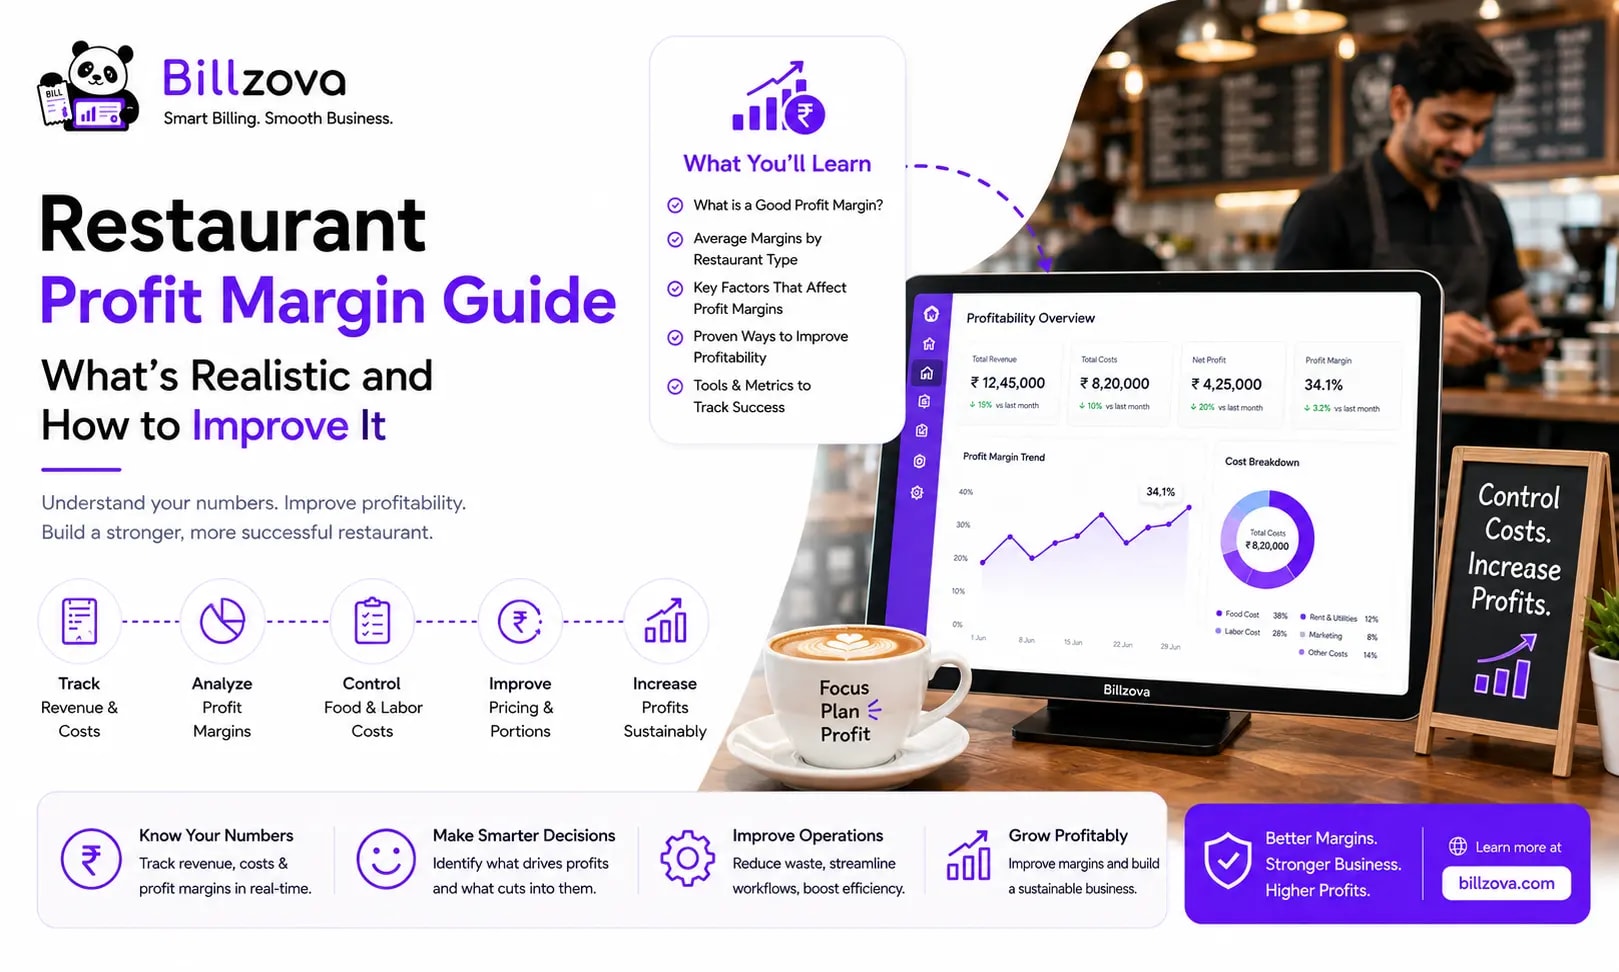
Revenue is the number every restaurant owner sees first — it's the total at the end of the day, the figure on the day-close report, the thing that feels like the scorecard. But revenue alone doesn't tell you whether the restaurant is actually making money. A restaurant can post record sales in a month and still lose money, if the cost of generating those sales grew faster than the sales themselves. Profit margin is the number that actually answers "is this restaurant working" — and most restaurant owners don't track it closely enough to answer that question with real confidence.
Peter Drucker
Management consultant and author
That's the right way to think about restaurant profit margin — not as a target to chase directly, but as the honest test of whether pricing, portioning, staffing and purchasing decisions are actually working. This guide covers what profit margin actually means, what realistic ranges look like using genuinely sourced industry benchmarks (not invented precision), the specific cost categories that determine it, and concrete ways to improve it.
What Restaurant Profit Margin Actually Means
Profit margin is what's left from revenue after subtracting the costs of generating it — most significantly food cost, labor cost, and overhead (rent, utilities, and similar fixed costs) — expressed as a percentage of revenue. It's the single number that determines whether a restaurant doing healthy daily sales is actually a profitable business, or one quietly running close to breakeven despite looking busy.
A restaurant can have strong, growing revenue and a shrinking or negative margin at the same time, if costs are growing faster than sales. This is exactly why revenue by itself is a misleading indicator of business health — it tells you activity, not profitability.
Types of Restaurant Profit: Gross, Net, Operating and More
"Profit" isn't one number — different profit figures answer different questions, and mixing them up is a common source of confusion.
| Term | What it measures | Formula |
|---|---|---|
| Gross profit | Revenue minus the direct cost of the food and drink sold (cost of goods sold) | Revenue − COGS |
| Contribution margin | Revenue minus variable costs (ingredients, and other costs that scale with each order) — what each additional sale actually contributes toward fixed costs | Revenue − Variable Costs |
| Operating profit | Gross profit minus operating expenses (labor, rent, utilities) — profit from core operations, before interest and tax | Gross Profit − Operating Expenses |
| EBITDA | Earnings before interest, tax, depreciation and amortization — a common way to compare operating performance across restaurants with different financing or asset structures | Operating Profit + Depreciation + Amortization |
| Net profit | What's actually left after every expense, including interest and tax — the real bottom line | Operating Profit − Interest − Tax |
For most day-to-day restaurant decisions, gross profit (via food cost percentage) and operating profit (via prime cost — food plus labor) are the two numbers that matter most, since they're the ones most directly affected by decisions made at the counter and in the kitchen every single day.
How to Calculate Restaurant Profit Margin
The core formula is straightforward:
Net Margin = (Revenue − Total Costs) ÷ Revenue × 100
A worked example makes this concrete. Say a restaurant does ₹10,00,000 in revenue in a month. Food cost is ₹3,20,000 (32% of revenue), labor cost is ₹3,00,000 (30% of revenue), and rent plus other overhead comes to ₹2,50,000 (25% of revenue).
| Line item | Amount | % of revenue |
|---|---|---|
| Revenue | ₹10,00,000 | 100% |
| Food cost (COGS) | ₹3,20,000 | 32% |
| Gross profit | ₹6,80,000 | 68% |
| Labor cost | ₹3,00,000 | 30% |
| Rent & overhead | ₹2,50,000 | 25% |
| Operating profit | ₹1,30,000 | 13% |
In this example, prime cost (food + labor) is 62% of revenue — inside the commonly cited healthy range — and operating margin lands at 13%, before interest, tax, and any one-off costs. This is a hypothetical, illustrative example, not a claim about what any specific restaurant actually earns — the real value is in running your own numbers through the same structure.
Realistic Profit Margins: What the Industry Actually Shows
Warning
With that caution stated plainly, there are genuinely well-established, widely-cited industry benchmarks worth knowing, even though they're not India-specific precision:
- Net profit margin: commonly cited in the 3–9% range industry-wide, with 5% or higher generally considered healthy. Restaurants are, structurally, a low-margin business — this isn't unique to any one market.
- Food cost percentage: a healthy range is commonly cited as 28–35% of revenue from the items that ingredient cost applies to.
- Labor cost percentage: commonly cited in the 25–35% of revenue range, though full-service formats often run toward the higher end of that.
- Prime cost (food + labor combined): widely used as the single most important operating benchmark — 55–65% of revenue is commonly cited as the healthy range, with every point above it compressing an already-thin net margin.
These are general industry benchmarks, not India-specific figures pulled from a formal government or industry-body survey — treat them as a reference point for the shape of a healthy cost structure, not a target to hit exactly. Indian rent and labor cost structures vary hugely by city and locality, which shifts the specific numbers even while the underlying framework — food cost, labor cost, prime cost — still applies.
Why Margin Differs by Restaurant Format
Rather than assign fabricated precise percentages to each format, here's the honest, directional reasoning for why margin structure genuinely differs:
| Format | What tends to pull margin up | What tends to pull margin down |
|---|---|---|
| Fine dining | Higher average check size | Higher labor cost (service staff ratio), premium ingredient cost, higher rent for the location a fine-dining concept usually needs |
| QSR / fast food | Lower labor cost per order, standardized portioning tightens food cost control | Lower average check size means thinner absolute margin per transaction even if the percentage is healthier |
| Cafe | High-margin beverages can offset lower-margin food items | Real estate cost per seat is often high relative to average check size |
| Cloud kitchen | Lower rent and front-of-house labor since there's no dine-in space | Aggregator platform commission on delivery orders is a real, recurring cost a dine-in sale doesn't carry |
| Bakery / sweet shop | Can carry strong margin on items with low per-unit ingredient cost | Ingredient cost volatility (seasonal pricing on ghee, dry fruits) can swing margin meaningfully month to month |
| Bar / pub | Beverage margin is typically strong | Liquor licensing and compliance costs, plus staffing for longer operating hours |
What matters more than any benchmark number from this table is tracking your own restaurant's actual margin consistently, and understanding specifically what's driving it up or down month to month — that's a more useful practice than chasing an industry-average figure that may not reflect your actual location, format, or scale.
The Biggest Factors Affecting Restaurant Profit
Margin is determined by a specific, knowable set of cost categories — not a vague sense of "costs are high."
Checklist
- Food cost — ingredient purchasing, portioning, and pricing
- Labor cost — staffing levels relative to actual demand, not a fixed schedule
- Rent — often the least controllable in the short term, but the most important to get right before signing a lease
- Wastage and shrinkage — spoiled stock, over-preparation, and unaccounted-for inventory
- Discounts and promotions — genuinely useful for driving volume, but a real cost that needs tracking, not an afterthought
- Delivery platform commissions — a real, recurring cost specific to aggregator-driven orders
- Utilities — gas, electricity, and water, which scale with volume more than owners often assume
- GST and compliance costs — not a margin killer by itself, but GST errors and the time cost of manual reconciliation are a real, avoidable drag
- Marketing spend — worth tracking against the actual repeat-customer and new-customer results it produces, not just spent on faith
Food cost and labor cost together — prime cost — are usually the two most controllable, most consequential categories, since unlike rent, they respond directly and immediately to operational decisions made every day.
Common Mistakes Restaurant Owners Make
Most margin problems trace back to a small, repeatable set of mistakes, not some hidden inefficiency:
- Poor menu pricing — pricing set once at menu launch and rarely revisited, even as ingredient costs shift over time.
- No real inventory control — stock tracked by memory or a periodic manual count rather than tied to actual sales.
- Overstaffing (or understaffing) — a fixed schedule that doesn't reflect actual demand patterns by shift.
- Ignoring reports — sales data exists but nobody reviews it regularly enough to catch a cost shift before it compounds.
- No recipe costing — menu decisions made on sales volume alone, with no visibility into which "bestsellers" are actually profitable.
- Manual billing — GST errors and reconciliation time that a correctly structured invoice would avoid entirely.
- Paper KOTs — order mistakes and kitchen mix-ups that directly increase wastage and rework.
- Cash leakage — discrepancies at day-close that go uninvestigated because there's no shift-level record of who billed what.
How to Increase Restaurant Profit Margin
Improving margin isn't about a single dramatic change — it's a set of specific, repeatable practices:
Best Practice
- Audit recipe costs against current ingredient prices regularly, not just at initial menu launch
- Identify low-margin "bestsellers" specifically, and adjust portion, recipe, or price rather than leaving them unexamined
- Reduce wastage through better portion control and purchasing discipline
- Match staffing levels to actual demand using shift-wise sales data, not a static schedule
- Promote genuinely high-margin items through menu placement and staff recommendations
- Review supplier pricing periodically, comparing across vendors where practical
- Track prime cost (food + labor) as a single number, not two disconnected percentages
- Review margin monthly at minimum, so a cost shift gets caught before it compounds across a full quarter
Every one of these depends on having accurate, current data — a recipe cost calculated from actual ingredient prices, shift-wise sales figures that reflect real demand, current supplier pricing. Without that data, "improve margin" advice stays generic because there's nothing specific to act on.
How Restaurant Billing Software Helps — Genuinely, Not as a Sales Pitch
None of the practices above require special software to do in principle — a disciplined restaurant could track all of this manually. What software actually changes is how much manual effort it takes, and how current the data stays.
| What you need to track | How it usually happens manually | How it works when billing, inventory and recipes are connected |
|---|---|---|
| Recipe cost per dish | A spreadsheet, updated occasionally, quickly out of date | Recalculates automatically when an ingredient's purchase price changes |
| Item-wise sales | Manually tallied from receipts or a register total | Available in real time from every bill, without separate entry |
| Inventory deduction | Periodic manual stock count | Auto-deducted per recipe on every sale |
| Wastage | Rarely tracked at all, or tracked inconsistently | Logged by reason (expired, spoiled, overproduction), so shrinkage becomes a specific, addressable cost |
| Shift-wise labor vs. sales | Cross-referencing a staff schedule against a sales report by hand | Shift ties directly to staff login, so sales-per-shift is a direct report, not a manual cross-reference |
| GST-correct billing | Manual tax calculation, real audit risk if CGST/SGST split incorrectly | Calculated and split automatically on every invoice, with correct GSTIN and sequential numbering |
This is the genuine case for connected restaurant billing software: not that it does anything a spreadsheet couldn't theoretically do, but that it makes the data current and automatic instead of a periodic manual exercise that quietly stops happening once things get busy. Billzova connects recipe-linked inventory, billing, and reporting directly — recipe costing recalculates as ingredient prices change, stock deducts automatically per sale, and shift-wise sales tie to staff logins — with GST-correct invoicing and full offline reliability built in, so none of it depends on a stable internet connection to keep working. Kitchen order tickets route instantly to the kitchen, cutting the order errors that directly increase wastage.
Restaurant Profit Margin Calculator: Worked Formulas
You don't need special software to calculate these — a calculator and your own numbers are enough to start.
| Metric | Formula | Worked example |
|---|---|---|
| Food cost % | (Ingredient cost ÷ Selling price) × 100 | ₹100 cost ÷ ₹400 price = 25% |
| Gross margin | ((Revenue − COGS) ÷ Revenue) × 100 | (₹10,00,000 − ₹3,20,000) ÷ ₹10,00,000 = 68% |
| Prime cost % | ((Food cost + Labor cost) ÷ Revenue) × 100 | (₹3,20,000 + ₹3,00,000) ÷ ₹10,00,000 = 62% |
| Net margin | (Net profit ÷ Revenue) × 100 | ₹1,30,000 ÷ ₹10,00,000 = 13% (operating margin, before interest/tax) |
| Break-even point (revenue) | Fixed costs ÷ (1 − Variable cost ratio) | ₹2,50,000 ÷ (1 − 0.62) ≈ ₹6,58,000 in monthly revenue needed to cover costs |
All figures above are hypothetical, illustrative numbers for showing how the formulas work — replace them with your own restaurant's actual revenue and cost figures to get a number that means something for your specific business.
A Realistic Profit Improvement Scenario
Consider a hypothetical mid-sized full-service restaurant with ₹10,00,000 in monthly revenue, a 34% food cost (slightly above the healthy range), and no recipe-level costing — meaning the owner doesn't actually know which menu items are dragging that number up.
| Before | After (illustrative) | |
|---|---|---|
| Food cost % | 34% (estimated, not measured per dish) | 29% (measured per dish, two overpriced-ingredient recipes repriced) |
| Wastage tracking | Untracked | Logged by reason, revealing one specific ingredient responsible for most spoilage |
| Prime cost | 64% (34% food + 30% labor) | 59% (29% food + 30% labor, labor unchanged) |
| Operating margin (illustrative) | ~6% | ~11% |
Nothing about this scenario required raising prices or cutting portions customers would notice — the improvement came entirely from replacing an estimate with an actual, per-dish number, and acting on what it revealed. This is a hypothetical, illustrative scenario for showing the mechanism, not a documented case study or a claim about a specific real business.
Key Metrics Every Restaurant Should Track
| Metric | What it tells you |
|---|---|
| Average Order Value (AOV) | Revenue per transaction — rising AOV with stable costs is a genuine margin improvement |
| Food Cost % | The single biggest controllable lever, ideally tracked per dish, not just overall |
| Labor Cost % | Whether staffing matches actual demand by shift |
| Prime Cost | Food + labor combined — the single most important operating health check |
| Repeat Customers | The cheapest revenue a restaurant gets — acquiring a new customer costs meaningfully more than retaining one |
| Revenue Per Table (or per seat) | How efficiently the physical space is being used, independent of total revenue |
| Inventory Turnover | How quickly stock moves — very slow turnover on any ingredient often signals overbuying or a menu item that isn't selling |
| Table Utilization / Turnover Time | How many times a table can genuinely be served in a shift — a real lever on revenue without adding seats |
Tracking all eight consistently, ideally through connected inventory and restaurant billing software rather than eight separate manual processes, is what turns "watching the numbers" from an occasional exercise into an ongoing operational habit.
Frequently Asked Questions
What is a good profit margin for a restaurant?
Commonly cited industry benchmarks put net margin in the 3–9% range, with 5% or higher generally considered healthy — but this varies by format, location and scale, so tracking your own restaurant's margin consistently matters more than chasing a single external number.
What's the difference between revenue and profit margin?
Revenue is total sales. Profit margin is what remains after subtracting the costs — food, labor, overhead — required to generate that revenue, typically expressed as a percentage.
What is food cost percentage, and how is it calculated?
A dish's ingredient cost divided by its selling price, expressed as a percentage. A healthy range is commonly cited as 28–35%, though calculating it accurately requires a real per-dish recipe cost, not an estimate.
What is prime cost, and why does it matter more than food cost alone?
Prime cost is food cost plus labor cost combined, commonly cited as healthy in the 55–65% range. It matters more than either number alone because a restaurant can have excellent food cost control and still have thin margin if labor cost is too high, or vice versa — prime cost catches both at once.
Why might a popular dish actually have poor profit margin?
Popularity reflects sales volume, not cost efficiency. A frequently ordered dish can still have thin or negative margin if its actual ingredient cost is higher than assumed — visible only through accurate, per-dish recipe costing.
How does labor cost affect restaurant margin?
Overstaffing during slow periods wastes direct labor cost; understaffing during busy periods can cost margin indirectly through lost sales and poor service. Matching staffing to actual shift-wise demand data helps balance both risks.
Can reducing food wastage really improve margin meaningfully?
Yes — since food cost is typically one of the largest expense categories, even a modest reduction in wastage has a direct, measurable effect on margin. Our guide on measuring food waste cost covers how to actually quantify it.
Should I raise menu prices to improve margin?
It can help, but should be based on actual recipe cost data showing where margin is genuinely thin, rather than an across-the-board increase that risks affecting demand without addressing the specific cost issue.
How often should I review my restaurant's profit margin?
Regularly enough to catch cost shifts before they compound — monthly at minimum for most restaurants, more often if ingredient costs or sales patterns are particularly volatile.
What's the easiest way to start tracking item-level margin if I'm not doing it currently?
Start by defining accurate recipes — exact ingredient quantities — for your top-selling dishes, then apply current ingredient pricing to calculate true cost per dish. This alone often reveals which "bestsellers" actually need attention.
Does restaurant POS software actually help with margin tracking, or is that a separate tool?
When billing and inventory management are properly connected, POS software can calculate real-time recipe costing automatically from the same data used for billing and stock — making margin tracking a byproduct of normal operations rather than a separate manual exercise.
What's the difference between gross margin and net margin?
Gross margin accounts only for the direct cost of food and drink sold (cost of goods sold). Net margin accounts for every cost — food, labor, rent, utilities, interest, and tax — making it the real bottom-line figure, always lower than gross margin.
Is a high food cost percentage always a problem?
Not automatically — a restaurant with strong beverage or high-margin add-on sales can sometimes run a slightly higher food cost percentage on food specifically and still land at a healthy overall margin. Prime cost, not food cost in isolation, is the more reliable health check.
How does GST affect restaurant profit margin?
GST itself is a pass-through tax, not a direct cost to the restaurant — but GST errors (incorrect CGST/SGST split, missing GSTIN, non-compliant invoices) create real audit risk and reconciliation time, which is a genuine, avoidable cost. Our GST billing guide covers what a compliant invoice actually requires.
What is contribution margin, and how is it different from gross margin?
Contribution margin subtracts variable costs (ingredients and other costs that scale with each order) from revenue, showing what each additional sale actually contributes toward covering fixed costs like rent. It's a more granular view than gross margin for decisions about whether a specific menu item is worth keeping.
Does discounting hurt profit margin?
It can, if it's not tracked as a real cost — a discount reduces revenue on that transaction without reducing the ingredient or labor cost behind it, so frequent, untracked discounting quietly compresses margin even while sales volume looks healthy.
How much does rent typically affect restaurant margin?
Rent is usually one of the largest fixed costs and one of the least flexible in the short term, which is exactly why it deserves the most scrutiny before signing a lease — a location decision affects margin for years, not just the current month.
What's the fastest way to see if a specific dish is actually profitable?
Calculate its real ingredient cost from an accurate recipe, compare it against the selling price to get food cost percentage for that one item, and compare that against your overall target — this takes minutes per dish and is the single fastest way to catch a mispriced "bestseller."
Does table turnover time actually affect profit margin?
Yes, particularly for full-service dine-in — faster, well-managed table turnover means more covers served in the same fixed rent and staffing cost, which directly improves revenue per table without needing more physical space.
Can a restaurant have healthy revenue and still be losing money?
Yes, and it's one of the more common blind spots — if costs (especially food and labor) are growing faster than revenue, total sales can look strong on a day-close report while the underlying margin is shrinking or negative.
Is average order value the same as profit margin?
No — a higher average order value increases revenue per transaction, but only improves margin if the cost of generating that larger order doesn't grow proportionally. A high-AOV order built on high-food-cost items can still carry a thin margin.
How does staff management connect to profit margin?
Labor is typically the second-largest controllable cost after food, and shift-wise sales-versus-staffing data is the clearest way to see whether staffing levels genuinely match demand. Our staff management guide covers the roles and scheduling side of this in more depth.
What's the relationship between menu engineering and profit margin?
Menu engineering is the practice of using both popularity and margin data together to decide what to promote, reprice, or remove — our menu engineering guide covers the specific framework for that decision.
Should a cloud kitchen calculate margin differently from a dine-in restaurant?
The core formulas are identical, but a cloud kitchen needs to include aggregator platform commission as a real cost category that a dine-in sale doesn't carry — leaving it out understates true cost and overstates margin on delivery orders specifically.
How does Billzova help with tracking restaurant profit margin?
Billzova connects billing, recipe-based inventory, and sales reporting directly, so recipe costing and item-wise margin data are available without separate manual tracking — restaurant POS software built around exactly this. Your first month is free.
The Bottom Line
Restaurant profit margin isn't a single number you check once a year — it's the output of food cost, labor cost, and item-level pricing decisions made daily, most of which stay invisible without the right data connected together. The restaurants that actually improve margin over time aren't the ones cutting costs reactively; they're the ones who can see, specifically, which dishes and which shifts are actually driving profitability versus just driving revenue.
If you want clearer visibility into your own restaurant's real margin, billzova connects billing, recipe costing, and GST billing in one system, included standard at ₹399/month. Start a free first month, or explore how it fits full-service restaurants, cafes, and cloud kitchens specifically.
Billzova Team
Restaurant POS & Billing Experts
We build Billzova — GST billing, KOT, offline mode, inventory and reports for Indian restaurants. This team writes from what we see helping real restaurants bill faster every day.
Run your restaurant on billzova
GST billing, KOT, offline mode, inventory & reports in one app. ₹399/month — first month free.